Monthly Archives: January 2019

Which Team is the Best Bet to Win the Wide Open Metropolitan Division?

There are some great competitions unravelling across the four divisions of the NHL this season, but as of just past the halfway mark, the Metropolitan Division looks to be the most heated contest of them all.

In the Metropolitan Division, the Columbus Blue Jackets, Washington Capitals, New York Islanders, and Pittsburgh Penguins had a mere three points between them at the point that they all hit the 46-game mark. The Blue Jackets and Capitals led the way with 59 points while the Islanders had pulled themselves up to 58, and a recent losing streak saw the Penguins sink to two points behind the Isles. It’s so closely contested, in fact, that the mid-January NHL power rankings had them at eighth, ninth, tenth, and 12th.

With them all so close in the running, we’ve decided to look into the four Metro contenders to decipher which team is most likely to end up on top of the division.

Who are the bookies backing in the Metro?

Source: The Hockey News, via Twitter

One of the best places to turn when trying to work out the team with the best chances to win is the odds in the sportsbook. As of the 46-game mark, the NHL betting sees the Columbus Blue Jackets ahead at +200 as the favorites. But, as we’ve seen, it’s a closely contested field, with the Caps at +270, the Isles at +280, and the Pens at +290.

NHL fans may want to make the most of the bookies perceiving the Blue Jackets as the favourites because they could be closing in on losing two of their most important players. Meanwhile, the Penguins have been in the market trying to improve their team, the Islanders are flying high, and the Capitals don’t seem to be showing any signs of a Stanley Cup hangover.

Columbus could soon implode

Source: Pittsburgh Penguins, via Twitter

They may be the favourites in the odds, but both Sergei Bobrovsky and Artemi Panarin are set to become free agents this summer, with neither player showing any indication of re-signing for the Blue Jackets. Bobrovsky, one of the best goaltenders in the NHL, has even seen himself benched for a couple of games due to an undisclosed incident.

Columbus has two choices in this situation, one of which is the anticipated trades of their star players at the trade deadline. Or, the Blue Jackets could go all-in, telling Bobrovsky and Panarin that they can go at the end of the season but need them now, and reinforce the squad around them by using their $6 million in cap space, per CapFriendly, at the trade deadline.

The current Metropolitan Division leaders will most likely lose at least one of the two players before the end of February, which puts them at a disadvantage to the other teams. The Capitals have been slipping since the New Year, but still boast a very strong team, while the Islanders’ momentum, forged on speedy offence and suffocating pressing play on defence, looks set to carry them to the postseason.

The interesting team to keep an eye on, and the team with the longest odds of the bunch, is the Pittsburgh Penguins. They’ve done well to recuperate their season by getting Sidney Crosby and Evgeni Malkin back in form and they continue to make small tweaks through trading to enhance the team. With another good run of form, the Pens could well end up on top of this division.

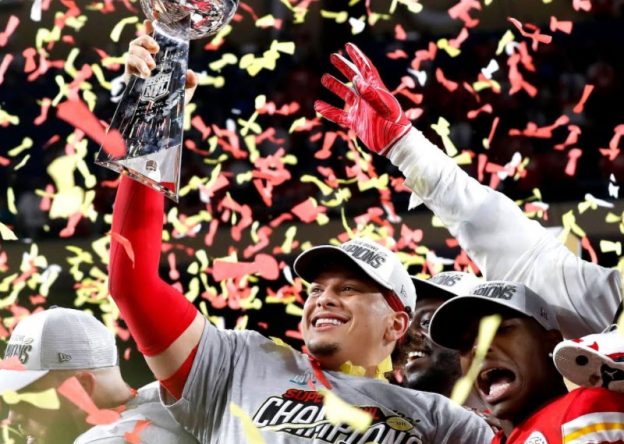
The Biggest Super Bowl Underdogs of All-Time

The Super Bowl is usually known for featuring some of the most competitive matchups in the NFL, based on the fact that the two teams competing in the game have to be playing at such a high level. But there have been times when the game is an anticipated blowout, with massive spreads heading into the game. These underdogs, in particular, were expected to get destroyed, as they were the biggest outsiders in the history of the Super Bowl.

San Diego Chargers – Super Bowl XXIX

San Diego was never going to defeat the San Francisco 49ers in Super Bowl XXIX but, then again, nobody else would have had a chance against them either. The Niners were a massive 18.5-point favourite with a spread that is, and likely will forever be, the biggest in the history of the Super Bowl. And, even more surprising, is the fact that they covered that huge spread, winning the game 49-26.

The Niners set the tone immediately, scoring on two touchdowns of 40 yards or more in the first quarter. Steve Young threw six touchdown passes in the game, while the Chargers could only muster two offensive touchdowns for the entire contest.

New York Jets – Super Bowl III

When Joe Namath made his guarantee that the New York Jets would win Super Bowl III over the Baltimore Colts, everyone thought he was crazy. But the only thing that was crazy about Super Bowl III was the fact that the Jets managed to win the game outright as 18-point underdogs. The game was different then, to the point that the Jets held the legendary Johnny Unitas and the Colts offense to just seven points for the game.

New England Patriots – Super Bowl XXXI

When the New England Patriots took on the Green Bay Packers in Super Bowl XXXI, the focus of the game was on Brett Favre, who was a heavy favourite to get his Super Bowl ring. The Patriots came into the game as 14-point underdogs and put up very little resistance as the Packers were superior to New England in just about every facet of the game. The Packers were the rare Super Bowl favourite to win the title, as they managed to avoid the pitfalls of the rest of the playoff gauntlet en route to their iconic victory.

New England Patriots – Super Bowl XXXVI

The Patriots were a 14-point underdog again in Super Bowl XXXVI when they took on another legendary offence. This time, it was the Greatest Show on Turf of the St. Louis Rams, and this time it was the Patriots scoring one of the legendary upsets in the history of the Super Bowl. The Rams exceeded their pre-season win total over/under of 11 games, with all-time great quarterback Kurt Warner getting the ball to Marshall Faulk, Torry Holt, and Isaac Bruce at the skill positions. But it was relatively unknown quarterback Tom Brady who set up the championship-winning drive, with Adam Vinatieri kicking the game-winning field goal to start the Patriots dynasty.

Super Bowl LIII Outlook

Heading toward Super Bowl LIII, the Patriots go into the divisional round of the playoffs at +600 odds to win the Super Bowl at Betway, far from the underdogs that they were before XXXVI. But they will have to get through one of the toughest playoff fields in recent NFL history to claim another title. Even one of the biggest underdogs in this year's postseason, the Dallas Cowboys, have been perennial contenders, being on the short list of title contenders in 2017 and 2018 as well. To say that it is truly anyone's title to win would be an understatement.

To win as a big underdog in the Super Bowl requires a great defensive performance and enough playmakers on offence to put together offensive sequences late in the game. But as teams like the Niners and Packers have shown, there is a reason that those teams are big underdogs, as the double-digit favourite in the Super Bowl is rare not just in terms of the point spread but in terms of how difficult it is to be a dominant team in the NFL. Barring a series of upsets in a season, it is unlikely there will be another double-digit Super Bowl favourite any time soon.

MLB Regular Season Win Total Results by Team – 2010’s

Below is a table of team by team MLB regular season win totals from 2010 to 2019

For each year we show the Vegas win total before the start of the season, the actual win total and result (over/under/push)

Team names shown are current (e.g. the Montreal Expos are listed as the Washington Nationals)

More results:      1990's     2000's       2010's     2020's

Team '10 '11 '12 '13 '14 '15 '16 '17 '18 '19 2010's Record
(Over-Under-Push)
Arizona Diamondbacks 82.5
65  U
72.5
94  O
86.5
81  U
82.5
81  U
81.5
64  U
72.5
79  O
81.5
69  U
77.5
93  O
85
82  U
75.5
85  O
4-6-0
Atlanta Braves 85.5
91  O
88
89  O
86.5
94  O
87.5
96  O
87.5
79  U
73.5
67  U
65.5
68  O
74.5
72  U
75
90  O
86
97  O
7-3-0
Baltimore Orioles 74
66  U
76.5
69  U
69.5
93  O
78.5
85  O
81.5
96  O
82.5
81  U
79.5
89  O
80.5
75  U
72.5
47  U
58.5
54  U
4-6-0
Boston Red Sox 94.5
89  U
95.5
90  U
90
69  U
83
97  O
88
71  U
86
78  U
86.5
93  O
92.5
93  O
92
108  O
94.5
84  U
4-6-0
Chicago Cubs 82
75  U
81.5
71  U
74.5
61  U
72.5
66  U
70
73  O
83
97  O
93.5
103  O
96.5
93  U
93.5
95  O
87.5
84  U
4-6-0
Chicago White Sox 82.5
88  O
84.5
79  U
74.5
85  O
81
63  U
76.5
73  U
81.5
76  U
80.5
78  U
69.5
67  U
72.5
62  U
73.5
72  U
2-8-0
Cincinnati Reds 79
91  O
85.5
79  U
87.5
97  O
91
90  U
84.5
76  U
77.5
64  U
70.5
68  U
69.5
68  U
74
67  U
78.5
75  U
2-8-0
Cleveland Guardians 74.5
69  U
71.5
80  O
78.5
68  U
77.5
92  O
80.5
85  O
84.5
81  U
85.5
94  O
93.5
102  O
94.5
91  U
90.5
93  O
6-4-0
Colorado Rockies 84.5
83  U
86.5
73  U
81.5
64  U
70.5
74  O
76.5
66  U
72.5
68  U
71.5
75  O
80.5
87  O
81.5
91  O
84.5
71  U
4-6-0
Detroit Tigers 80
81  O
84.5
95  O
92.5
88  U
92.5
93  O
90
90  P
83.5
74  U
81.5
86  O
82.5
64  U
67
64  U
68.5
47  U
4-5-1
Houston Astros 74.5
76  O
71.5
56  U
63.5
55  U
59.5
51  U
62.5
70  O
76.5
86  O
88.5
84  U
90.5
101  O
97.5
103  O
96.5
107  O
6-4-0
Kansas City Royals 71.5
67  U
68.5
71  O
79.5
72  U
77.5
86  O
82
89  O
80.5
95  O
84.5
81  U
76.5
80  O
70
58  U
69.5
59  U
5-5-0
Los Angeles Angels 84
80  U
83
86  O
92.5
89  U
91.5
78  U
86.5
98  O
87.5
85  U
80.5
74  U
79.5
80  O
84.5
80  U
82.5
72  U
3-7-0
Los Angeles Dodgers 84.5
80  U
83.5
82  U
81.5
86  O
91.5
92  O
92.5
94  O
92.5
92  U
89.5
91  O
94.5
104  O
95.5
92  U
93.5
106  O
6-4-0
Miami Marlins 81
80  U
82
72  U
85.5
69  U
63.5
62  U
69.5
77  O
81.5
71  U
78.5
79  O
76.5
77  O
63.5
63  U
63.5
57  U
3-7-0
Milwaukee Brewers 80
77  U
85.5
96  O
84.5
83  U
81
74  U
80
82  O
78.5
68  U
70.5
73  O
70.5
86  O
83.5
96  O
86.5
89  O
6-4-0
Minnesota Twins 83.5
94  O
85.5
63  U
73.5
66  U
67.5
66  U
70.5
70  U
71.5
83  O
79.5
59  U
74.5
85  O
83
78  U
83.5
101  O
4-6-0
New York Mets 80.5
79  U
77.5
77  U
73.5
74  O
75
74  U
74
79  O
82.5
90  O
89.5
87  U
87.5
70  U
82.5
77  U
85.5
86  O
4-6-0
New York Yankees 95
95  P
91.5
97  O
93.5
95  O
88
85  U
87
84  U
81.5
87  O
85.5
84  U
83.5
91  O
94.5
100  O
96.5
103  O
6-3-1
Oakland Athletics 79
81  O
83.5
74  U
72
94  O
84.5
96  O
88.5
88  U
82.5
68  U
75.5
69  U
73.5
75  O
75.5
97  O
83.5
97  O
6-4-0
Philadelphia Phillies 92.5
97  O
96.5
102  O
93.5
81  U
84
73  U
76.5
73  U
67.5
63  U
64.5
71  O
72.5
66  U
78.5
80  O
89.5
81  U
4-6-0
Pittsburgh Pirates 69.5
57  U
67.5
72  O
73.5
79  O
77
94  O
84.5
88  O
85
98  O
86.5
78  U
83
75  U
74
82  O
77.5
69  U
6-4-0
San Diego Padres 71.5
90  O
75.5
71  U
73.5
76  O
74.5
76  O
79
77  U
83.5
74  U
73.5
68  U
66.5
71  O
72.5
66  U
78.5
70  U
4-6-0
San Francisco Giants 82
92  O
87.5
86  U
87.5
94  O
88
76  U
86.5
88  O
82.5
84  O
88.5
87  U
88.5
64  U
79.5
73  U
73.5
77  O
5-5-0
Seattle Mariners 83.5
61  U
70
67  U
72
75  O
77.5
71  U
81
87  O
87.5
76  U
82.5
86  O
85.5
78  U
81.5
89  O
71.5
68  U
4-6-0
St Louis Cardinals 88.5
86  U
82.5
90  O
84.5
88  O
86.5
97  O
91.5
90  U
87.5
100  O
87.5
86  U
83.5
83  U
86
88  O
88.5
91  O
6-4-0
Tampa Bay Rays 89
96  O
84.5
91  O
86.5
90  O
85.5
91  O
88
77  U
79.5
80  O
82.5
68  U
78.5
80  O
74
90  O
84.5
96  O
8-2-0
Texas Rangers 84
90  O
86.5
96  O
91
93  O
86.5
91  O
87
67  U
75.5
88  O
83.5
95  O
85.5
78  U
75
67  U
71.5
78  O
7-3-0
Toronto Blue Jays 70.5
85  O
76.5
81  O
80.5
73  U
89
74  U
80.5
83  O
82.5
93  O
86.5
89  O
85.5
76  U
81.5
73  U
74.5
67  U
5-5-0
Washington Nationals 71
69  U
72
80  O
84
98  O
91.5
86  U
89.5
96  O
94
83  U
88.5
95  O
91.5
97  O
93.5
82  U
89
93  O
6-4-0

MLB Regular Season Win Total Results by Team – 2000s

Below is a table of team by team MLB regular season win totals from 2000 to 2009

For each year we show the Vegas win total before the start of the season, the actual win total and result (over/under/push)

Team names shown are current (e.g. the Montreal Expos are listed as the Washington Nationals)

More results:      1990's      2000's      2010's   2020's

Team '00 '01 '02 '03 '04 '05 '06 '07 '08 '09 2000's Record
(Over-Under-Push)
Arizona Diamondbacks 89.5
85  U
85.5
92  O
90.5
98  O
90.5
84  U
82.5
51  U
70.5
77  O
74
76  O
77.5
90  O
87.5
82  U
87.5
70  U
5-5-0
Atlanta Braves 96.5
95  U
93.5
88  U
90.5
101  O
91
101  O
85.5
96  O
89.5
90  O
89
79  U
81.5
84  O
85.5
72  U
84.5
86  O
6-4-0
Baltimore Orioles 79.5
74  U
68.5
63  U
67.5
67  U
71.5
71  U
82
78  U
81
74  U
76.5
70  U
73.5
69  U
64.5
68  O
74.5
64  U
1-9-0
Boston Red Sox 90.5
85  U
89.5
82  U
86.5
93  O
92
95  O
96.5
98  O
97
95  U
90.5
86  U
90.5
96  O
94
95  O
93.5
95  O
6-4-0
Chicago Cubs 74.5
65  U
74.5
88  O
87.5
67  U
82
88  O
92
89  U
88
79  U
85
66  U
85.5
85  U
87
97  O
92.5
83  U
3-7-0
Chicago White Sox 74.5
95  O
88.5
83  U
89.5
81  U
87
86  U
82.5
83  O
81
99  O
91.5
90  U
86.5
72  U
79.5
89  O
78.5
79  O
5-5-0
Cincinnati Reds 92.5
85  U
84.5
66  U
78.5
78  U
78.5
69  U
72.5
76  O
77
73  U
74
80  O
76.5
72  U
77.5
74  U
79.5
78  U
2-8-0
Cleveland Guardians 93.5
90  U
88.5
91  O
83.5
74  U
71.5
68  U
74.5
80  O
83
93  O
90
78  U
84.5
96  O
90
81  U
84.5
65  U
4-6-0
Colorado Rockies 78.5
82  O
86.5
73  U
77.5
73  U
73.5
74  O
73.5
68  U
67.5
67  U
68.5
76  O
74.5
90  O
83
74  U
77.5
92  O
5-5-0
Detroit Tigers 77.5
79  O
77.5
66  U
72.5
55  U
64
43  U
67
72  O
78.5
71  U
77
95  O
87.5
88  O
93.5
74  U
80.5
86  O
5-5-0
Houston Astros 88.5
72  U
80.5
93  O
87.5
84  U
89
87  U
90.5
92  O
84
89  O
83.5
82  U
78.5
73  U
75
86  O
73.5
74  O
5-5-0
Kansas City Royals 71.5
77  O
78.5
65  U
68.5
62  U
65
83  O
80
58  U
64
56  U
64
62  U
67.5
69  O
73.5
75  O
74.5
65  U
4-6-0
Los Angeles Angels 76.5
82  O
77.5
75  U
81.5
99  O
91.5
77  U
91
92  O
91.5
95  O
88.5
89  O
89.5
94  O
92
100  O
88.5
97  O
8-2-0
Los Angeles Dodgers 84.5
86  O
84.5
86  O
84.5
92  O
86
85  U
83
93  O
84.5
71  U
85.5
88  O
88.5
82  U
86.5
84  U
84.5
95  O
6-4-0
Miami Marlins 66.5
79  O
80.5
76  U
80.5
79  U
74.5
91  O
80
83  O
85.5
83  U
67
78  O
78.5
71  U
69
84  O
75.5
87  O
6-4-0
Milwaukee Brewers 69.5
73  O
77.5
68  U
74.5
56  U
64
68  O
66.5
67  O
68.5
81  O
80.5
75  U
81.5
83  O
84.5
90  O
81.5
80  U
6-4-0
Minnesota Twins 66.5
69  O
72.5
85  O
81.5
94  O
87.5
90  O
85.5
92  O
87.5
83  U
80
96  O
83.5
79  U
75
88  O
82.5
87  O
8-2-0
New York Mets 90.5
94  O
88.5
82  U
90.5
75  U
86.5
66  U
81.5
71  U
85
83  U
91
97  O
88
88  P
93.5
89  U
90.5
70  U
2-7-1
New York Yankees 96.5
87  U
92.5
95  O
98.5
103  O
99
101  O
99.5
101  O
101.5
95  U
100
97  U
97
94  U
93.5
89  U
96.5
103  O
5-5-0
Oakland Athletics 84.5
91  O
88.5
102  O
89.5
103  O
94
96  O
89
91  O
83
88  O
88.5
93  O
84.5
76  U
73.5
75  O
80.5
75  U
8-2-0
Philadelphia Phillies 80.5
65  U
72.5
86  O
82.5
80  U
87.5
86  U
92
86  U
83
88  O
81.5
85  O
88.5
89  O
87.5
92  O
88.5
93  O
6-4-0
Pittsburgh Pirates 79.5
69  U
74.5
62  U
69.5
72  O
73.5
75  O
66.5
72  O
73
67  U
75.5
67  U
71.5
68  U
70
67  U
69.5
62  U
3-7-0
San Diego Padres 71.5
76  O
74.5
79  O
77.5
66  U
72.5
64  U
85
87  O
85.5
82  U
77.5
88  O
84
89  O
84.5
63  U
71.5
75  O
6-4-0
San Francisco Giants 86.5
97  O
86.5
90  O
89.5
95  O
86
100  O
83.5
91  O
82.5
75  U
81.5
76  U
81.5
71  U
73
72  U
78.5
88  O
6-4-0
Seattle Mariners 83.5
91  O
81.5
116  O
95.5
93  U
90
93  O
88.5
63  U
76
69  U
75.5
78  O
75.5
88  O
85
61  U
71.5
85  O
6-4-0
St Louis Cardinals 88.5
95  O
89.5
93  O
92.5
97  O
90
85  U
84.5
105  O
92.5
100  O
94
83  U
84.5
78  U
76
86  O
81.5
91  O
7-3-0
Tampa Bay Rays 78.5
69  U
70.5
62  U
65.5
55  U
65.5
63  U
69.5
70  O
70
67  U
67.5
61  U
67
66  U
75
97  O
88.5
84  U
2-8-0
Texas Rangers 87.5
71  U
84.5
73  U
85.5
72  U
80.5
71  U
71.5
89  O
81.5
79  U
80.5
80  U
81.5
75  U
76
79  O
74.5
87  O
3-7-0
Toronto Blue Jays 83.5
83  U
78.5
80  O
77.5
78  O
78.5
86  O
82.5
67  U
70
80  O
86
87  O
86.5
83  U
85.5
86  O
80.5
75  U
6-4-0
Washington Nationals 73.5
67  U
74.5
68  U
69.5
83  O
75.5
83  O
73.5
67  U
69.5
81  O
77
71  U
66.5
73  O
72.5
59  U
73.5
59  U
4-6-0

MLB Regular Season Win Total Results by Team – 1990s

Below is a table of team by team MLB regular season win totals from 1990 to 1999

For each year we show the Vegas win total before the start of the season, the actual win total and result (over/under/push). 1994 and 1995 results are not available due to the strike.

Team names shown are current (e.g. the Montreal Expos are listed as the Washington Nationals)

More results:      1990's      2000's      2010's      2020's

Team '90 '91 '92 '93 '94 '95 '96 '97 '98 '99 1990's Record
(Over-Under-Push)
Arizona Diamondbacks                 71.5
65  U
86.5
100  O
1-1-0
Atlanta Braves 70
65  U
75
94  O
87.5
98  O
95.5
104  O
98
68  N/A
N/A
90  N/A
100
96  U
96
101  O
97.5
106  O
96.5
103  O
6-2-0
Baltimore Orioles 77
76  U
81
67  U
76
89  O
89.5
85  U
90
63  N/A
N/A
71  N/A
89
88  U
88
98  O
91.5
79  U
88.5
78  U
2-6-0
Boston Red Sox 85
88  O
85
84  U
88
73  U
80
80  P
81
54  N/A
N/A
86  N/A
86.5
85  U
78
78  P
84.5
92  O
83.5
94  O
3-3-2
Chicago Cubs 84
77  U
88
77  U
83.5
78  U
80.5
84  O
83
49  N/A
N/A
73  N/A
82
76  U
79
68  U
81.5
90  O
81.5
67  U
2-6-0
Chicago White Sox 71
94  O
83.5
87  O
87.5
86  U
90
94  O
90
67  N/A
N/A
68  N/A
84
85  O
88
80  U
80.5
80  U
71.5
75  O
5-3-0
Cincinnati Reds 83
91  O
87
74  U
88
90  O
90
73  U
83
66  N/A
N/A
85  N/A
86
81  U
83
76  U
75.5
77  O
84.5
96  O
4-4-0
Cleveland Guardians 79
77  U
76
57  U
65
76  O
80
76  U
83
66  N/A
N/A
100  N/A
100
99  U
94
86  U
91.5
89  U
93.5
97  O
2-6-0
Colorado Rockies       60
67  O
75
53  N/A
N/A
77  N/A
83.5
83  U
84
83  U
85.5
77  U
83.5
72  U
1-4-0
Detroit Tigers 73
79  O
74.5
84  O
77.5
75  U
77.5
85  O
78
53  N/A
N/A
60  N/A
67.5
53  U
62
79  O
77.5
65  U
75.5
69  U
4-4-0
Houston Astros 83
75  U
68
65  U
68
81  O
86.5
85  U
85
66  N/A
N/A
76  N/A
84
82  U
84
84  P
83.5
102  O
87.5
97  O
3-4-1
Kansas City Royals 90
75  U
88
82  U
85.5
72  U
86
84  U
84
64  N/A
N/A
70  N/A
76.5
75  U
78
67  U
72.5
72  U
65.5
64  U
0-8-0
Los Angeles Angels 84
80  U
82
81  U
82
72  U
72
71  U
71
47  N/A
N/A
78  N/A
86.5
70  U
76
84  O
86.5
85  U
88.5
70  U
1-7-0
Los Angeles Dodgers 82
86  O
90
93  O
87.5
63  U
80.5
81  O
83
58  N/A
N/A
78  N/A
88
90  O
89
88  U
89.5
83  U
92.5
77  U
4-4-0
Miami Marlins       58
64  O
67
51  N/A
N/A
67  N/A
80
80  P
89
92  O
72.5
54  U
60.5
64  O
3-1-1
Milwaukee Brewers 85
74  U
81.5
83  O
81
92  O
85.5
69  U
72
53  N/A
N/A
65  N/A
72
80  O
78
78  P
76.5
74  U
73.5
74  O
4-3-1
Minnesota Twins 79.5
74  U
76
95  O
81
90  O
87
71  U
73
53  N/A
N/A
56  N/A
70.5
78  O
78
68  U
70.5
70  U
68.5
63  U
3-5-0
New York Mets 88
91  O
88
77  U
88.5
72  U
84
59  U
71
55  N/A
N/A
69  N/A
82
71  U
76
88  O
84.5
88  O
91.5
97  O
4-4-0
New York Yankees 83
67  U
74
71  U
76.5
76  U
85
88  O
88
70  N/A
N/A
79  N/A
87.5
92  O
86
96  O
93.5
114  O
104.5
98  U
4-4-0
Oakland Athletics 92
103  O
93
84  U
87.5
96  O
85.5
68  U
76
51  N/A
N/A
67  N/A
66.5
78  O
75
65  U
70.5
74  O
76.5
87  O
5-3-0
Philadelphia Phillies 73
77  O
77
78  O
80.5
70  U
81
97  O
85
54  N/A
N/A
69  N/A
75.5
67  U
66
68  O
73.5
75  O
76.5
77  O
6-2-0
Pittsburgh Pirates 78
95  O
85.5
98  O
85
96  O
82
75  U
75
53  N/A
N/A
58  N/A
68
73  O
60
79  O
74.5
69  U
72.5
78  O
6-2-0
San Diego Padres 88
75  U
83
84  O
79.5
82  O
78
61  U
67
47  N/A
N/A
70  N/A
77.5
91  O
86
76  U
86.5
98  O
73.5
74  O
5-3-0
San Francisco Giants 87
85  U
87.5
75  U
81
72  U
83
103  O
90
55  N/A
N/A
67  N/A
77.5
68  U
71
90  O
82.5
89  O
83.5
86  O
4-4-0
Seattle Mariners 73
77  O
79.5
83  O
82
64  U
80
82  O
84
49  N/A
N/A
79  N/A
87
85  U
90
90  P
91.5
76  U
80.5
79  U
3-4-1
St Louis Cardinals 85
70  U
71
84  O
78
83  O
86.5
87  O
85
53  N/A
N/A
62  N/A
84.5
88  O
87
73  U
86.5
83  U
81.5
75  U
4-4-0
Tampa Bay Rays                 66.5
63  U
68.5
69  O
1-1-0
Texas Rangers 78
83  O
79
85  O
83
77  U
80
86  O
87
52  N/A
N/A
74  N/A
82.5
90  O
84
77  U
83.5
88  O
87.5
95  O
6-2-0
Toronto Blue Jays 86
86  P
87.5
91  O
88
96  O
92.5
95  O
87
55  N/A
N/A
56  N/A
72
74  O
85
76  U
80.5
88  O
84.5
84  U
5-2-1
Washington Nationals 77
85  O
80
71  U
76
87  O
90.5
94  O
87
74  N/A
N/A
66  N/A
73
88  O
78
78  P
69.5
65  U
69.5
68  U
4-3-1

Super Bowl favorites entering the NFL playoffs

Below is a table of the Super Bowl favorites heading into the NFL playoffs and how they have performed. Also listed are the pre-playoffs odds of the eventual Super Bowl winner

Summary: since 1974 the Super Bowl favorite entering the playoffs has won the Super Bowl 19 times; lost in the Super Bowl 12 times; lost in the Conference Championship game 8 times and lost in the Divisional round 11 times. Note that if there were multiple favorites in a single season then we counted the team that went further in the playoffs.

Season Super Bowl
Favorite
Team(s)
Super Bowl
Favorite
Seed(s)
Super Bowl
Favorite
Odds
Super Bowl
Favorite
Result(s)
Super Bowl
Winner
Super Bowl
Winner
Seed
Super Bowl
Winner
Odds
Super Bowl
Winner
Odds Rank
2023 San Francisco 1 +225 Lost SB Kansas City 3 +1000 5th
2022 Kansas City 1 +325 Won SB Kansas City 1 +325 1st
2021 Green Bay 1 +375 Lost Div LA Rams 4 +1100 6th
2020 Kansas City 1 +200 Lost SB Tampa Bay 5 +1200 T-5th
2019 Baltimore 1 +200 Lost Div Kansas City 2 +400 3rd
2018 New Orleans 1 +200 Lost CC New England 2 +600 4th
2017 New England 1 +200 Lost SB Philadelphia 1 +1500 6th
2016 New England 1 +140 Won SB New England 1 +140 1st
2015 Carolina
Arizona
New England
1
2
2
+450 Lost SB
Lost CC
Lost CC
Denver 1 +500 T-4th
2014 Seattle 1 +225 Lost SB New England 1 +250 2nd
2013 Seattle
Denver
1 +250 Won SB
Lost SB
Seattle 1 +250 T-1st
2012 Denver 1 +275 Lost Div Baltimore 4 +2000 8th
2011 Green Bay 1 +175 Lost Div NY Giants 4 +2200 7th
2010 New England 1 +275 Lost Div Green Bay 6 +1200 7th
2009 Indianapolis 1 +275 Lost SB New Orleans 1 +400 T-2nd
2008 NY Giants 1 +300 Lost Div Pittsburgh 2 +500 2nd
2007 New England 1 -400 Lost SB NY Giants 5 +5000 10th
2006 San Diego 1 +200 Lost Div Indianapolis 3 +600 T-4th
2005 Indianapolis 1 -125 Lost Div Pittsburgh 6 +800 5th
2004 New England 2 +250 Won SB New England 2 +250 1st
2003 New England 1 +200 Won SB New England 1 +200 1st
2002 Philadelphia 1 +400 Lost CC Tampa Bay 2 +700 6th
2001 St Louis 1 +100 Lost SB New England 2 +900 4th
2000 Tennessee 1 +300 Lost Div Baltimore 4 +1200 T-6th
1999 St Louis 1 +160 Won SB St Louis 1 +160 1st
1998 Minnesota 1 +120 Lost CC Denver 1 +150 2nd
1997 Green Bay 2 +160 Lost SB Denver 4 +1000 5th
1996 Green Bay 1 +160 Won SB Green Bay 1 +160 1st
1995 Dallas
San Francisco
1
2
+220 Won SB
Lost Div
Dallas 1 +220 T-1st
1994 San Francisco 1 -167 Won SB San Francisco 1 -167 1st
1993 Dallas 1 +120 Won SB Dallas 1 +120 1st
1992 San Francisco 1 +150 Lost CC Dallas 2 +300 2nd
1991 Washington 1 -125 Won SB Washington 1 -125 1st
1990 San Francisco 1 -125 Lost CC NY Giants 2 +600 4th
1989 San Francisco 1 +140 Won SB San Francisco 1 +140 1st
1988 Chicago 1 +300 Lost CC San Francisco 2 +400 T-2nd
1987 San Francisco 1 +100 Lost Div Washington 3 +1000 6th
1986 NY Giants 2 +250 Won SB NY Giants 2 +250 1st
1985 Chicago 1 +100 Won SB Chicago 1 +100 1st
1984 San Francisco 1 +180 Won SB San Francisco 1 +180 1st
1983 Washington 1 +200 Lost SB LA Raiders 2 +300 2nd
1982 LA Raiders 1 +400 Lost Div Washington 1 +600 3rd
1981 Cincinnati 1 +250 Lost SB San Francisco 1 +350 3rd
1980 San Diego
Atlanta
2
1
+300 Lost CC
Lost Div
Oakland 4 +1500 T-9th
1979 Pittsburgh 2 +160 Won SB Pittsburgh 2 +160 1st
1978 Dallas 2 +120 Lost SB Pittsburgh 1 +180 2nd
1977 Dallas
Oakland
1
4
+250 Won SB
Lost CC
Dallas 1 +250 T-1st
1976 Oakland 1 +300 Won SB Oakland 1 +300 1st
1975 Pittsburgh 1 +200 Won SB Pittsburgh 1 +200 1st
1974 Oakland 1 +300 Lost CC Pittsburgh 3 +600 T-5th

Round abbreviations: WC = Wild Card, Div = Divisional, CC = Conference Championship, SB = Super Bowl