|
Baseball is considered one of the top sports in North America. The modern version of baseball has been played in the United States since the 19th century. Interestingly, many of the numbers revolving around the game like Earned Run Average and Batting Average have been in place since the 1850s. Yet, it is only in the last couple of decades that baseball has witnessed tremendous interest in statistical analysis.
Most Common Baseball Statistics
Batting Average
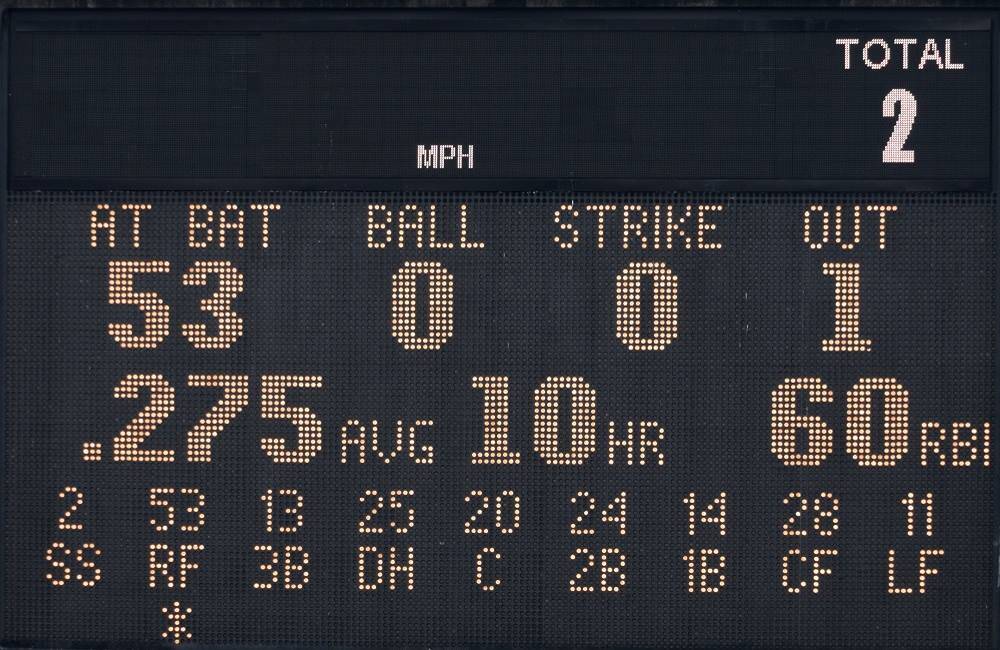
One of the most common statistics in the game, batting average (BA) is useful to gauge the performance of individual players. If a player has a high batting average, it is a strong sign that they can come up with a higher percentage of successful hits. A hit occurs when the ball has been hit into a legal territory and the player manages to reach first base at the very least. This metric can have a big impact on the game outcome.
Earned Runs Average (ERA)
The Earned Runs Average, or ERA, is a statistic which is primarily used to gauge the performance of pitchers. The runs allowed by the pitcher are divided by the total number of innings and it will then be multiplied by nine, as most of the baseball matches comprise of nine innings.
WHIP
This is a pitcher statistic that can be very crucial to knowing more about the ability of an individual to keep the opposition quiet. If the WHIP number is lower, it indicates better performance from the player. The ERA is an indirect way of measuring the pitcher's performance, but WHIP is a more direct statistic. Generally, the top pitchers in the MLB league tend to have this number at around 1.00 after the end of a campaign.
Strikeout
For those learning on how to bet on baseball, this is a statistic that applies to both batters and pitchers. A strikeout happens when the batter has accumulated three strikes during his time at the bat. The batter is considered to be out if their third strike does not get caught and they end up reaching the first base. If a strikeout occurs, it indicates that the pitcher has been more dominant than the batter.

|
Other factors to consider when betting on baseball events
There are additional statistics in baseball that can come in handy when trying to place a wager on this sport. Apart from the individual statistics, team performance data can also be understood through the likes of:
Historical Trends
A look into historical data will reveal patterns and trends that can be immensely useful while placing the upcoming bet. For example, a bettor will be able to get that competitive edge by knowing how teams have done after the All-Star break. Likewise, the form shown by a team towards the end of a season can also hide several patterns, which can be useful in predicting the upcoming games.
Home vs Away Performances
The location of a match can have a significant impact on the team's performance, as statistics have shown a marked improvement in performance when some teams play at home vs away from home.
Making Use of the Statistics in Baseball Betting
Baseball is one of the biggest early adopters of statistics. It has had a big impact on teams and leagues in the past. No single metric is going to help in the world of baseball betting. A bettor who is into the world of baseball betting can make use of several statistics in conjunction to reach a conclusion.
For example, one can identify a game outcome by looking into statistics like pitcher ERA, batting average, team run differential, and more. Each statistic can offer a crucial insight into the performance of a player or a team. For example, it is a big deal for players to have low ERA numbers, as it is an indication of not leaking runs. Dutch Leonard holds the record for the lowest ERA in a single season, as he averaged only 0.96 in 1914.
If numbers like ERA and batting average can be considered as traditional means of understanding performance, modern bettors are leaning towards advanced stats like wOBA or Weighted On-Base Average. Such advanced stats can act as a good metric for pitchers and hitters.
The higher wOBA numbers are good for hitters while pitchers can be expected to come up with good performance as if they have low wOBA numbers. In 2023, the average wOBA was 0.318 compared to 0.310 during the 2022 season. If hitters have a wOBA of more than 0.318, they are considered to be in excellent form. An excellent campaign in 2024 for Shohei Ohtani was aptly reflected by his wOBA figures of 0.433.
It does not take long to understand that baseball and statistics are almost intertwined. The success of a baseball bettor no longer needs to be based on gut feeling. The use of statistical data has not only impacted the game on the pitch, but it can also have a positive impact on the betting scenario.


